Table of Contents
Toggle
Axis long term equity fund is a type of ELSS. The first rule of ELSS is that it has a lock-in period of a minimum of 3 years.
ELSS comes under Section 80C for tax exemption, we have done a comparison study for ELSS vs PPF. Axis as AMC holds many mutual funds across Gilt funds, debt funds, equity mutual funds, and ELSS funds. One of the fastest-growing in India.
The main advantage of Axis mutual funds is its expense ratio. They offer the lowest expense ratio when compared to their peer.
There are some evergreen funds managed by Axis AMC like Axis Blue Chip fund, Axis Midcap funds, Axis multi-cap funds, Axis Focused 25 funds, Axis liquid funds, Axis ultra-short funds, and finally Axis long-term equity funds.
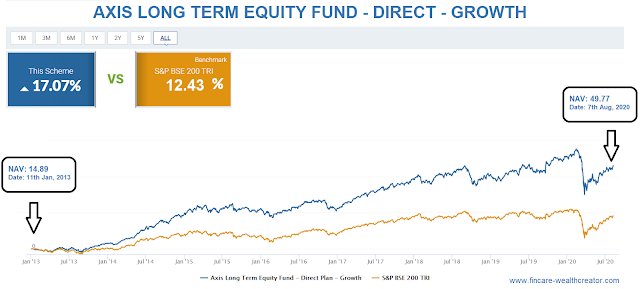
We are going to discuss a fund which had given a CAGR of 17% per year for the last 10 years. Also, it has beaten the index of S&P BSE 200TRI.
DISCLAIMER: Fincare Wealth Creator never involves in promotion of any investment products. This is just a knowledge sharing as many of our subscribers asked for. It is completely up to you, kindly check with your financial advisor before investing.
Why Axis Long Term Equity Funds:
· The foremost, most of you will be paying income taxes. To get an exemption, will invest in many classes under section 80C. Which one of the investment options is ELSS?
· When it comes to ELSS, you can check this fund’s performance, risk, and reward. This fund has performed beyond its category index.
· Also, the 5 years performance has a lower risk than the category benchmark.
· The funds hold 93.44% equity shares in 37 companies, 0.13% in the debt market, 6.4% TREPS, and 0.03% in receivables.
· Well diversified fund allocation across large-cap (62.94%), Mid Cap (16.49%), and Small-cap (5.66%).
· The expense ratio for the direct fund is 0.92% (category Average – 1.2%) and for the regular fund is 1.73% (category average – 2.11%)
· This is one of the best ELSS funds available in the Indian market.
If you don’t have a Section 80C submission for tax exemption, please avoid this ELSS fund and invest in other large or mid-cap funds.
Axis Long Term Equity Fund – Performance Since Inception:
· The fund was started on 29th December 2009, with the NFO (New Fund Offer) of Rs. 10 per Unit.
· The fund has outperformed its category index by 17% CAGR yearly for the last 10 years.
· The fund performed at an 18.5% yearly return before the COVID-19 market crash.
· While the market crashed, the fund managed the crash compared to the index. Hence, it showed a 5.7% return last year.
Please find the graph on the fund’s performance below. Source: Money Control.

· The amount invested in 2010 has grown almost 5 times. i.e., 1 lakh invested in 2010 is currently around 5 lakhs.
· Axis long term equity fund has 60.39% of its weightage in the top 10 holdings.
· The fund was beating the category and all the funds before the COVID – 19 Crash as
§ 1 Year Performance – 5.72% P.A vs 5.6% P.A
§ 2 year performance – 1.79% P.A vs (-2.64%) P.A
§ 3 year performance – 6.75% P.A vs 0.98% P.A
§ 5 year performance – 8.28% P.A vs 6.05% P.A
Axis Long Term Equity Fund – Post Covid Crash:
· Post the market crash due to COVID-19, the fund has not performed ahead of its benchmark.
· The main reason is, only the top 10 companies of the Index are driving the market. Please have a look at the Factors driving the current share price in India
· Since, the fund is diversified by all large, mid, and small-cap funds the performance is a little behind the benchmark.·
· The market is positioned to hold its position between 10500-13000 for Nifty 50. So once the market consolidates, there is a better chance for the fund to perform
· The performance post COVID-19 crash vs category.
§ 1 week performance – 2.35% vs 2.52%
§ 1 month Performance – 1.56% vs 4.63%
§ 3 month performance – 15.22% vs 21.15%
§ 6 months performance – (-10.7%) vs (-8.64%)
· So, the performance after the crash favors the index. Still, the fund has performed better than most other ELSS funds.
Risk Ratios:
- Standard Deviation – 19.49 vs 18.59 (category Avg)
- Beta – 0.85 vs 0.79 (category Avg)
- Sharpe Ratio – 0.18 vs -0.07 (category Avg)
- Treynor’s Ratio – 0.04 vs -0.02 (category Avg)
- Jension’s Alpha – 1.56 vs -1.87 (category Avg)
So, the overall calibration on risk and rewards is slightly less risky than the category and the best risk-adjusted return.
Pros:
- 5-years returns are more than the category benchmark.
- Lower expense ratio.
- The fund size is 20291 crores.
- Performance is more than the benchmark from inception
- Better risk adjusted return.
Cons:
- Last 6 months performance is lower than the benchmark.
- Slightly more risky than the category.
Conclusion:
- Axis’ long-term equity fund is one of the currently performing ELSS funds.
- The fund has a lesser expense ratio compared to the category.
- It has shown a 17% annual growth performance from the time of inception.
- The NAV has grown almost 5 times in 10 years.
- The risk is slightly higher, and the reward is higher than the benchmark.
Equity investments are subject to market risk. Kindly go through the relevant documents before investing.