CAMS is generally known as COMPUTER AGE MANAGEMENT SERVICES. The company shifts itself to the public sector through an IPO through an offer for sale.
The issue size of the IPO is rupees 2244.3 Cr for 1.82 Cr shares. They provide a special discount of Rs. 120 per share to employees.
The offer for sale is majorly due to the redemption of NSE’s complete holding of 37.48% and Great Terrain becoming a promoter with a 43.5% share.
This article is not promotional towards this IPO, rather before investing in a company, you should understand it,
- Business Model.
- Revenue growth.
- Assets and liabilities.
- Fundamental and Intrinsic Value of the company.
We always mention that “Invest in a company for its business and value and not on price or momentum in the market”.
CAMS IPO – Business Overview:
The company produces technology-based services for mutual funds industries. That includes,
- Transaction
- Dividend
- Payment
- Settlement
- Brokerage Compensation
- Compliance
- Electronic related services
They are the biggest registrar and transfer agents of transactions related to mutual funds. They hold 70% of the market share leading front ahead of their competitor Karvy (27%) and Franklin (3%).
In addition to this, they also have footprints in serving other sectors
- Loans against Mutual funds
- Insurance companies.
- AMFI
- AIF & PMS
- Banks
- NBFC
The company has backed with Rs. 721.34 Cr for the FY 2019-20. The revenue split across operations is,
- Data Processing (76.72%)
- Customer Care Service (8.67%)
- Recoverable (5.03%)
- Miscellaneous Services (5.38%)
- Software license fees, development, and Support (1.2%)
- Others (0.3%)
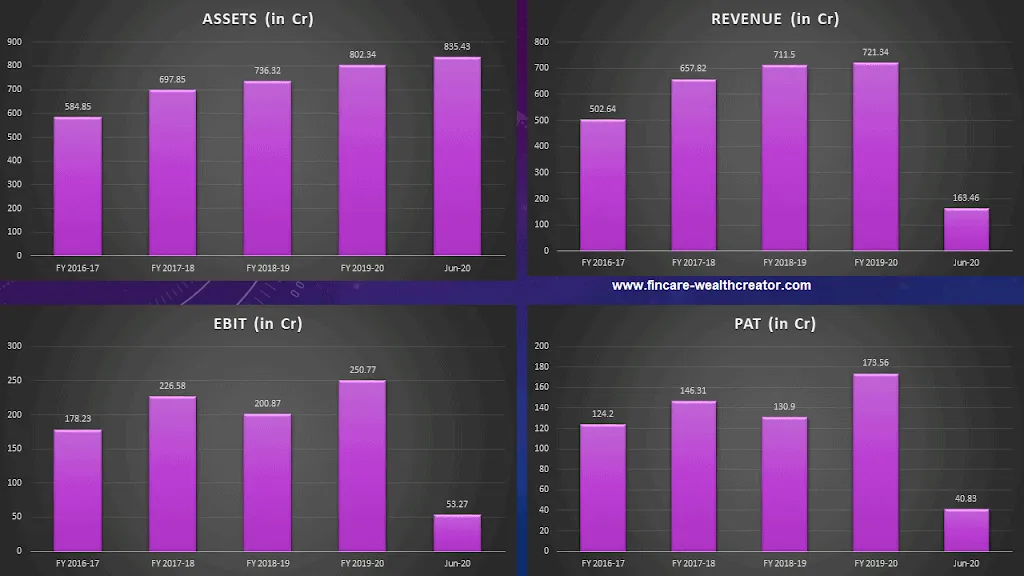
CAMS IPO – Financial Analysis:

The above image is the pictorial representation of CAMS from FY 2016-17 to FY 2019-20 and Jun-2020.
The company’s assets have grown at a rate of 8.22% per annum in the last 4 years.
In the last 5 years, the revenue has grown at a rate of 12.8%, and 4 year’s growth is almost 9.47%.
Profit after tax also has seen better growth in the last 4 years of 8.73%
Amid the COVID situation, the company has shown a sustainable business which equals the average quarterly sales of FY2019-20.
Since the company has acquired 70% of the market share, it behaves as a monopoly in its business.
As mutual funds and schemes are increasing day by day, CAMS is going to benefit.
Let us have a snap of how the mutual fund has grown in the last 5 years. The industry is growing at a rate of 14.87%.

CAMS 80% of revenue is generated through the mutual funds business. So, the company is looked to be in good shape for long term investors.
CAMS IPO – Fundamental Analysis:
As an intelligent investor, you should be focusing on calculating the value of the company by
- Fundamental Earnings of the Company.
- Excess cash per Share.
- Intrinsic value.
Fundamentals:
The current Earnings per Share (FY2019-20) is 35.57.
The 3-year growth of EPS is 11.77%.
P/E Ratio: The Total number of shares the company holds is 4.88 Cr shares.
The current P/E ratio (FY2019-20) is 35.44.
This is a very high valuation in terms of more than 35 times the earnings per share.
ROE (Return on Equity) – 31.4% (last three years)
ROCE (Return on Capital Employed) – 34.44(last three years)
Excess Cash Per Share:
Excess cash per share is termed the liquidable cash that a company has. This is the corpus that which company holds after the investments, dividends, and all the expenses.
Excess cash is positive for a company.
Current Assets:
Investments – 315.52 Cr
Cash and Cash Equivalents – 2.92 Cr
Bank Balance – 81.04 Cr
Other Assets – 5.88 Cr
Fixed Assets:
Investments – 0.55 Cr
Property Asset – 63.27 Cr
Other Assets – 71.7 Cr
Total Liquidable Assets (Current & Fixed) = 540.88 Cr
Total Liabilities – Rs. 307.26 Cr
Excess Cash (Liquidable) = Total Liquidable Assets – Total Liabilities
= 233.62 Cr
So, Excess cash (Liquidable) per Share – Rs. 47.87
Intrinsic Value:
With the growth of Revenue which has seen 12.87% over the last 5 years, the intrinsic value should be Rs. 656.
When we expect a growth of 20%, the intrinsic value will be Rs. 979.4.
These values are calculated without a margin of safety (MOS).
If we calculate with a minimum 20% margin of safety,
The intrinsic value will be ranging between – Rs. 524.8 to Rs. 783.53 per share.
So, as per the intrinsic value calculation, the IPO price band is overvalued by 56%.
Strength:
· The company has a 70% market share in the mutual fund’s digital industry.
· The 5-year revenue is growing by 12.87% per year.
· The excess cash per share is 47.87%
· There was significant growth in both EPS and PAT.
· Strong fundamentals in cash flow and business management.
· Strong ROE and ROCE have been significantly seen.
Weakness:
· Apart from Mutual funds, the business of other operational sectors like insurance and NBFCs has started falling.
· The revenue is from paper based Mutual funds AMC’s. In recent days, many AMC’s are focusing on digital transformation. This might affect revenue growth.
· High P/E of 35.44.
· The IPO price of CAMS is 56% overvalued than the intrinsic value.
Important Details of CAMS IPO:
· IPO Opening Date: 21 September 2020.
· IPO Closure Date: 23 September 2020.
· Face Value: Rs. 10 per Share
· Issue Price band: Rs. 1229 – Rs. 1230 per share
· IPO lot Size – 12 shares
· Minimum Lot – 1 Lot – Rs. 14, 760.
· Maximum Lot – 13 Lots – Rs. 1, 91, 880.
· Finalization of Allotment – 28th September 2020
· Initiation of Refund – 29th September 2020
· Credit of shares to DEMAT Account – 30th September 2020
· IPO Shares Listing in the market – 1st October 2020.
Conclusion:
· Here we have a share of the details of CAMS as a company.
· It is always insisted not to invest in a company with 35 times earnings.
· Of course, in this bullish market, all the IPO’s are launched at a high price band.
· IPO becomes complete speculation and the risk is totally in your hands.