Table of Contents
ToggleD Mart is also known as Avenue Supermarket, started by well-recognized value investor Mr. Radhakishan Damani in the year 2002.
Beyond an investor, his vision as a businessman in the retail sector has made 214 retail outlets from 2 stores in 2002-2003. D Mart share is one of the finest investor’s choices as it has provided them with a high return in the last 4 years.
The retail chain business has emerged into 11 states and 1 union territory. D Mart has a presence in most of the important cities in India.
This franchise-based retail chain business currently earns revenue from the operation of Rs. 24,339 Crores in FY20-21.
The growth was at -2% compared to FY2019-20 of Rs. 24,930 crores.
Disclaimer: Fincareplan doesn’t promote on purchase of any securities. This is a knowledge-sharing article on D Mart and its performance. Equity is subject to market risk, one should study the relevant documents always before investing.
D MART Share – Business Model:
· Avenue supermarket is been operated with a unique selling model.
· In the retail store industry where there are many players, D-Mart offers, “best quality consumer products at a lower price than the MRP”
· The founder of the company understood the concept of purchasing a store vs renting a store.
· Now, they hold 90% of self-owned properties. So, the rental expenses which are a big expense are minimal. Initially, there was a low profit accumulated since they had to buy properties.
· They have three models of stores. They are Hyper, Express, and Super.
· They target middle-class people as they have all consumer goods at one retail outlet and their cheaper prices.
· They are implementing a few strategies by which they could generate good profit and at the same time offer a lesser price than the industry.
§ Cash Discount – They pay their vendor in the early period and save the interest cost. The same amount they reduce in MRP.
§ Trade Discount – This is also known as volume discount. When they purchase in 1000’s of quantity there will be a volume discount as well as an offer. Which they deduct from the customer’s MRP.
§ Slotting Fees – When a manufacturing company needs to sell its goods to D Mart. They have to pay slotting fees, so they are allowed to sell in all the retail shops of Avenue supermarkets across India. This makes them cut some amount in MRP.
§ Positioning of the products – We all know that the products positioned at our eyesight will be our first preference over the products occupied at the bottom. Also, the products are positioned near the billing counter. So, these products are placed at special discounts offered by the company.
· Regional products are given top priority in the stores. So, the regional people will be the main reason for the sale. Also, they can resist their supply chain locally.
· Space Optimization – They work on a strategy to generate more revenue in less space available. They are the only company to calculate revenue per square foot.
· Also, they have built their brands on the high volume of purchasing products. Their brands are Dmart Minimax, Dmart Premia, D Homes, Dutch Harbor, etc.
Key Products Categories of D Mart Share:
They generally categorized all the products into three categories. They are
- Foods FMCG
- Non – Foods FMCG
- General Merchandise
Foods FMCG is their focused category as almost 52.40% of revenue comes from there. The growth over the last year was 2.2%
The second focus is on Non-Food FMCG which shares almost 20.29% of total revenue.
The third focus is on General Merchandise shares for 27.31% of total revenue.
D MART Share Key Performance Indicator – FY2019-20 & Q1’2021:
1. Revenue from Operation:
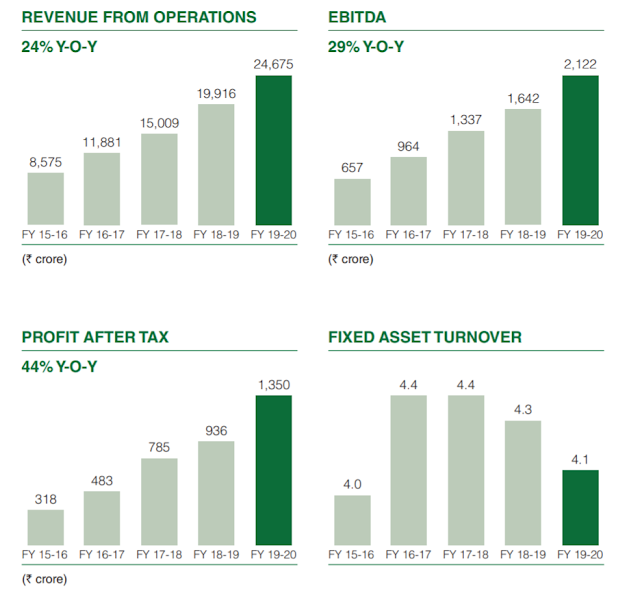
Total revenue of FY19-20 is almost 24,675 crores with a growth of 24% compared to the previous FY. Also, shared a Y-O-Y (year on year) growth of 23.53% for the last 5 years.
The revenue of Q1’2021 is 3884.57 crores. The average quarter revenue of FY19-20 was 6168.75 crores. The growth has come down to -37.02%
2. EBITA – Earnings before Interest, Tax, and Amortization:
Strong performance over EBITA of 2122 crores with a growth of 29% compared to previous FY. The Y-O-Y growth accounts for 26.42% for the last 5 years.
3. PAT – Profit after tax:
The PAT has shown a great growth of 44% of 1350 crores compared to FY18-19. The Y-O-Y growth is 33.5% for the last 5 years.
Q1’2021 PAT is at 48.43 crores, last quarter (Q4’2020) was at 286.87 crores. The average PAT of FY2019-20 was 337.47 crores. The growth is around -85.65%
4. EPS – Earnings per Share:
EPS is at 21.49 for FY19-20 and has grown by 43.26% when compared to the previous year. The Y-O-Y growth is 32.28% in the last 5 years
TTM (trailing 12 Months) EPS is at 16.10. Since Q1’2021 EPS has fallen drastically to Rs. 0.77. In Q4’2020 it was at Rs. 4.49. The average of FY2019-2020 is 5.23. The growth is at -85.26
5. Debt Equity Ratio:
The D/E ratio has come down from 0.12 to 0.03 in FY2019-2020. This is the biggest parameter for investors to understand that their company is debt-free.
6. Current Ratio:
The Current ratio is the calculation of the ratio between the assets and the liabilities. The Current ratio is currently at 3.18 from 1.67 in the previous year. This means the company’s assets are 3 times ahead of its liabilities.
Note: The Q1’2021 results have a great fall due to the COVID-19 lockdown and other logistics crisis.
Even at this rate of fall in earnings of Q1’2021, the stock price seems to be in the same position. Let us now calculate the fundamental analysis of the stock based on TTM (last 12 months Performance).
Fundamental Analysis – D MART Share:
Valuation Ratio:
Fundamental Analysis is to be understood by its valuation.
D Mart Share price – 2131.95 (11th August 2020 – Closing Time)
- Book value – 171.04
- P/B – 12.46
- EPS (TTM) – 16.1
- P/E – 132.42
- 5 years EPS Growth – 32.28%
- Dividend – 0
The P/B is 12.46 times higher than the book value. The industry P/B is 9.68, anyhow it is higher by nearly 3 times.
The P/E is almost 132 times more than the 12 months of earnings. The sectoral P/E is 44.42. So, it is almost 90 times higher trading than the sector.
Even the stock price comes down to the industry average. The price should be 715
Source: Ticket Tape
The share price is highly priced when compared to its fall in all financial parameters in the Q1’2021 quarterly report. The earning fundamentals are so strong and still, the value of the share is high.
You can’t buy a pen that is Rs. 100 for Rs. 1000 even in demand. So, understand the value of the purchase by calculating the intrinsic value.
Intrinsic Value of D MART Share:
§ The 5 years growth of EPS is 32.28
§ Let us take last year’s EPS (FY2019-20) – 20.49
§ Let us have a minimal Margin of Safety – 20%
These data are considered with last year’s performance. The FY2020-21 performance in terms of earnings will be even worse. Amid all the COVID situations, we have taken the previous year’s data. Even with those earnings,
Intrinsic Value = 800 (with a 20% margin of safety)
Intrinsic Value = 1010 (without any margin of safety)
So, considering the earning of FY2019-20, the perfect value to purchase the stock is around 800-1010. So, you can understand the price at which the D Mart is traded is almost two times the intrinsic value.
When you invest in any growing share without valuation, you will end up in the trap of the Greater Fool theory.
Pros:
§ Higher than Industry revenue growth. 29.9% growth in the last 5 years compared to the industry of 19.99%
§ Increasing Market Share. In the last 5 years, the market share has increased from 49.05% to 75.92%
§ Net Income is higher than the industry with 43.79% vs 32.76% in the last 5 years
§ EPS growth has been tremendous in the last 5 years with 32.26% Y-O-Y.
§ The earnings are increasing year on year and grabbing market shares.
§ Excess cash per share is Rs. 41.16
Cons:
§ The valuation is too high, 2 times more than intrinsic value.
§ The P/E ratio is 132 times more than the TTM Earnings.
§ No Dividend.
§ High P/B ratio
To open a Demat account. Please click the link
Conclusion:
§ One of the promising companies with revenue growing at 24% per year.
§ Earnings per share is almost growing at the rate of 33% per year in the 5 years
§ All the fundamentals of earning are perfect like no debt company, the current ratio is at 3.67.
§ The valuation and price of the share are at great controversy. The stock is highly priced as P/E is at 132.
§ The intrinsic value is at 1010 without any margin of safety, and with 20% MOS, the intrinsic value is 800.

