Table of Contents
ToggleOne of the most important indices of the National Stock Exchange is the Nifty 50 index (N50) and the Nifty Next 50 index (NN50). Investors will look at these indices to understand the market condition.
N50 and NN 50 are the share market indicators indicating the entry and watchpoints.
Here, we will learn about the performance of two indices and their fundamental earnings.
In the long run, say more than 20 years, we will understand that indices would be the best way of investing. Indices have shown a promising return.
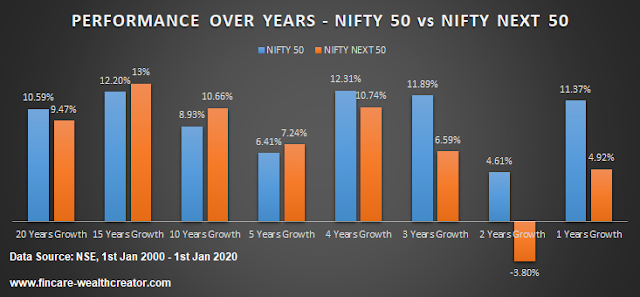
The period is between 1st Jan 2000 to 1st Jan 2020. So, it covers 20 years, in which N50 provides 10.59% Y-O-Y and NN50 assures almost 9.5% Y-O-Y
Definition:
The Nifty 50 index holds the top 50 companies in India based on market capitalization. The most recent company listed is HDFC Life Insurance, which replaced Vedanta groups.
Nifty Next 50 is the index that holds the top 51-100 companies in India. Recently, SBI cards entered this index, replacing HDFC life insurance.
Why Indices?
These two indices deal with the top and well-established companies. Investing in the index will be well-diversified and low-risk compared to other equity investments, such as shares or mutual funds.
In recent years, investors have shifted their focus to investing in indices by ETF and Index fund.
Over the past ten years, indices have performed better than many actively managed funds despite any crashes or corrections.
The index’s risk is lower than a nominal return for goal-based investments.
When we have both these indices in our portfolio, the return can be 10-12% per annum.
Valuation:
Valuation is the calculation used to understand the price condition, whether the market price is highly valued or the perfect value to invest in.
In this section, we will only examine the P/B and P/E ratios of the Nifty 50 and Nifty Next 50.
NIFTY 50 Index:
- Current valuation: P/E – 31.09; P/B – 3.15
- YTD (2020) Average Value: P/E – 25.06; P/B – 3.0
- March& April Month Value: P/E – 20.92; P/B – 2.5 (COVID-19 crash)
NIFTY NEXT 50 Index:
- Current Valuation: P/E – 70: P/B – 3.87
- YTD (2020) Average value: P/E – 65; P/B – 3.5
- March & April Month Value: P/E – 54; P/B – 2.7
N50 has a high value when the P/E reaches more than 20. NN50’s high-value range of P/E will be around 55.
When the market moves more than this P/E, it will be ready for a correction or recession. If not, it will stagnate, and its return will be less than the bank’s.
Investors should watch the Nifty 50 P/E when it moves more than 23 times earnings. We should stay out of the market and wait for the opportunity.
Performance N50 vs NN50:
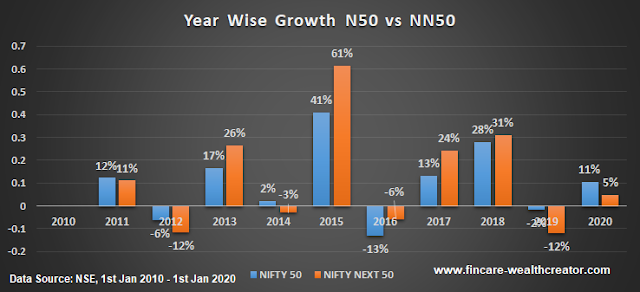
Here, the performance of two indices is compared between 1 January 2010 and 1 January 2020. We will understand the performance every year for the next 10 years.
5 years of performance are dominated by N50, and five more years by NN50.

From the graph, we can understand that whenever the market falls or a depression occurs, N50’s performance is ahead of NN50’s and vice versa.
That is why we always suggest having N50 and NN50 in your portfolio.
In 2015, strong performance was seen in N50 and NN50 with 41% and 61% returns, respectively.

Source: NSE Website
The next comparison is the year-on-year performance, comprising 20, 15, 10, 5, 4, 3, 2, and 1-year. This analysis of the year’s performance has made us realize that the index performs on an average of 10% return in a long time.
The maximum return over a particular time frame is 12%, so an investor should consider a 12 percent annual return suitable. In the last four years, the market has been well dominated by N50. The main reason is that the P/E ratio was too high in NN50.
This was a clear indication of an overvalued market. In this situation, the return will be more stagnant. Investors can now wait and watch the market by preserving their capital.
Understanding N50 and NN50:
As investors, we should understand the data and the performance before COVID-19 crashes.
If we analyze the current market, the performance of the Nifty Next 50 index is worse than that of the Nifty 50 index.
Between 2015 and 2018, NN50 showed huge growth, and the market was a huge bubble. This is why NN50 has produced a negative return in the last three years.
So, investors should have an idea, as the market has been performing to produce a 10% return every year for the last 20 years.
So, come off the mindset that mutual funds will produce 20% year-on-year return and be happy with the mindset of 10-12% return, which is fantastic in the long run.
This is the return of the lump sum invested 20 years back. If we invest periodically whenever the market falls and wait for another fall, the return would be more than 14% annually.
It is difficult to time the market, but one can understand market behavior. Have your investments in N50 and NN50, as both can yield a 10-12% return per year. You can invest in indices through an index fund and ETF.
Conclusion:
· Nifty 50 and Nifty Next 50 should be in the portfolios of every investor as it promises a definite return in the long run.
· The volatility and risk involved in the main indices are minimal compared to any other funds or stocks.
· Plan your investment goal on the return of the index. So, a 10% return every year is the ideal aim of return we should look for.
· It is not about investing in N50 or NN50, but in a long time, N50 has shown nearly 1% more return than NN50.